Spatial Analytics done right in Microsoft Power BI
With Galigeo, any user can create, analyze and share relevant cartographic representations of their business, by leveraging spatial analysis features and built-in data catalog.
Now available directly from the Microsoft AppSource

The Most Comprehensive Spatial Analytics Solution for Power BI
Powerful
Galigeo solution coupled with Power BI allows users to display and analyze large volumes of data on their maps.
Self-service
You don’t need to be a GIS or cartographic expert to map and analyze your data.
Natively integrated
Create and use your maps directly in your Power BI reports.
Galigeo For Power BI
Meaningful maps made for business
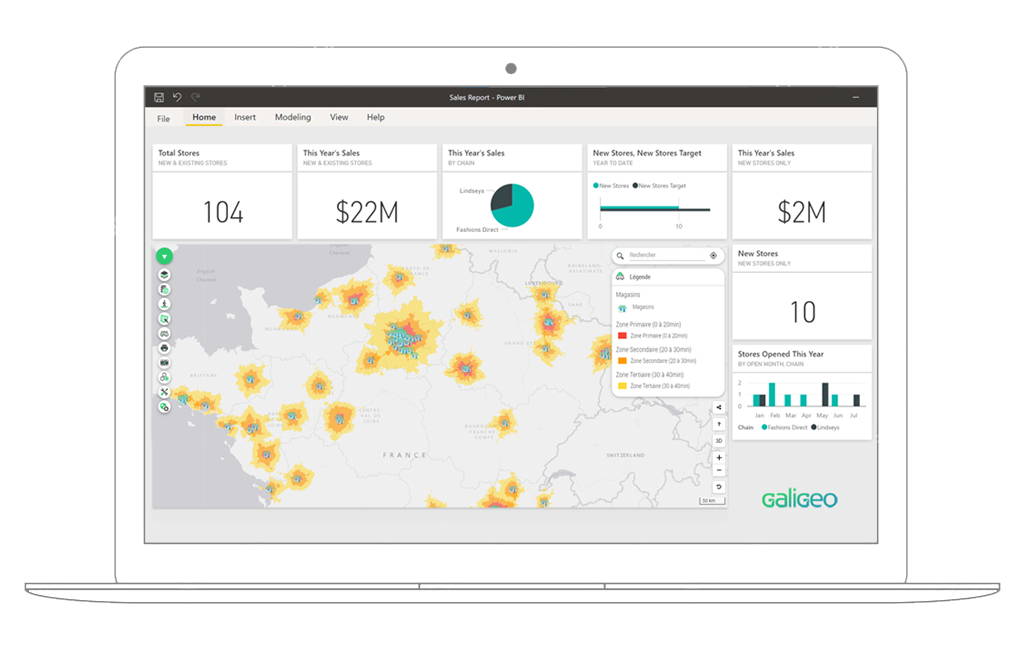
Galigeo offers ready-to-use business cartographic functionalities, such as the creation of flow maps, the calculation of the catchment area or the dynamic management of territories.
Users can thus create layers of information in a few clicks with their data, and correlate them with more than 350 pre-calculated indicators provided by Galigeo.
All core built-in features at your fingertips
Galigeo for Microsoft Power BI offers a wide range of features available at the click of a button, allowing you to map and analyze the data essential to your business.
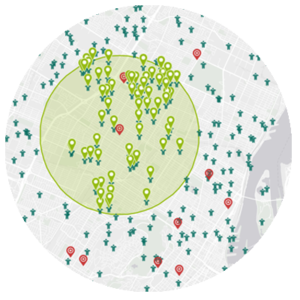
Geodata Catalog
Activate ready-to-use geodata, and easily correlate them with your business data.
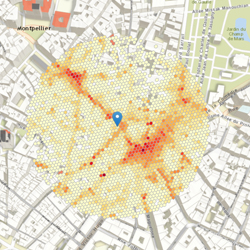
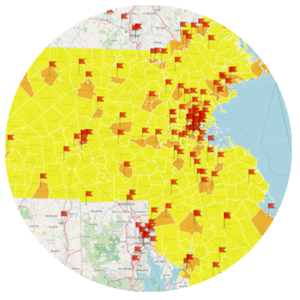
Advanced Visualisations
Represent the data the way it is meaningful for you, such as heatmap, cluster, choropleth, …
Spatial Selection
Filter data using spatial selection toold, such as isodistance or drive-time.
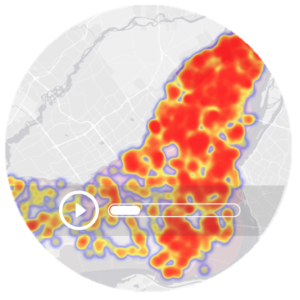
Spatial Time Series
Animate your data by choosing a time axis, and observe the evolution of your indicators through space and time.
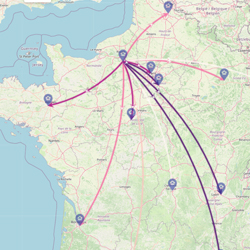
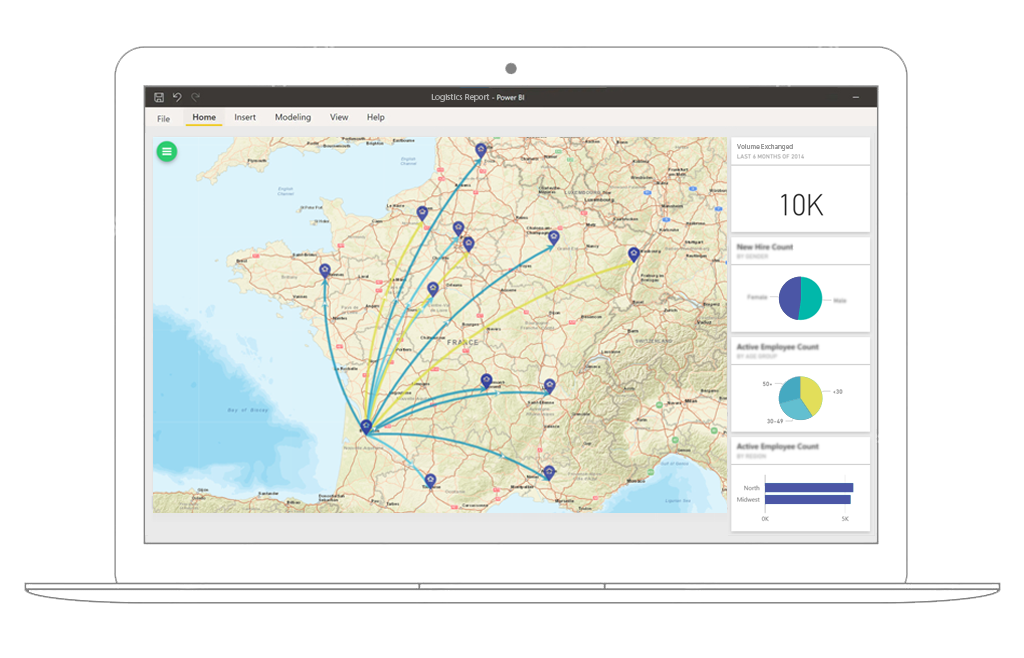
Flow Map
Easily create animated flow maps and share them with your team.
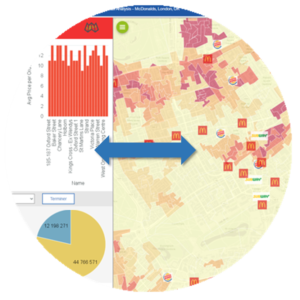
Bidirectional Filter
Perform actions on the map to interact with all the other components of your reports, and vice versa.
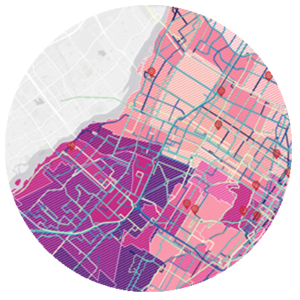
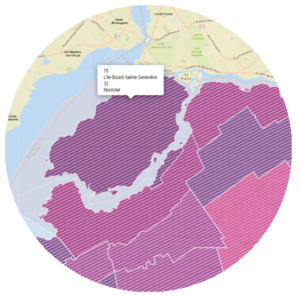
Territory Management
Create, balance and consolidate new territories according to the KPIs you want.
Collaboration
Collaborate by commenting and annotating directly on the map, to share your insights with your team.
And more!
Try Galigeo for Power BI for free, and discover hundreds of different options to create meaningful map of your business.
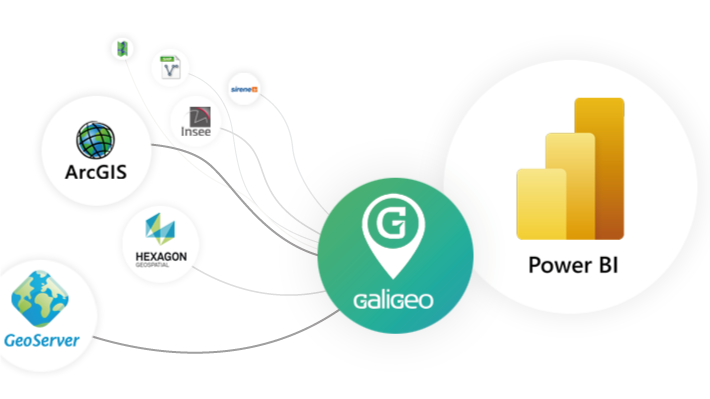
All the data you need
With Galigeo, connect to your GIS servers like Esri ArcGIS or Geoserver or simply import your shapefiles, geojson and KML locally, and correlate your geographic data with your business data.
Leverage a wide catalog of built-in geodata and indicators to enrich your analysis capabilities and quest for insights.
Cartographic Visualizations and Spatial Analysis
Why you need Galigeo
Galigeo is the only solution to offer both a wide range of visualization options, coupled with business features that meet real analysis needs.
Amongst others, calculate the catchment area of a point of sale, manage the territories of your sales representatives or analyze your logistics flows in an animated way, all in a few clicks.
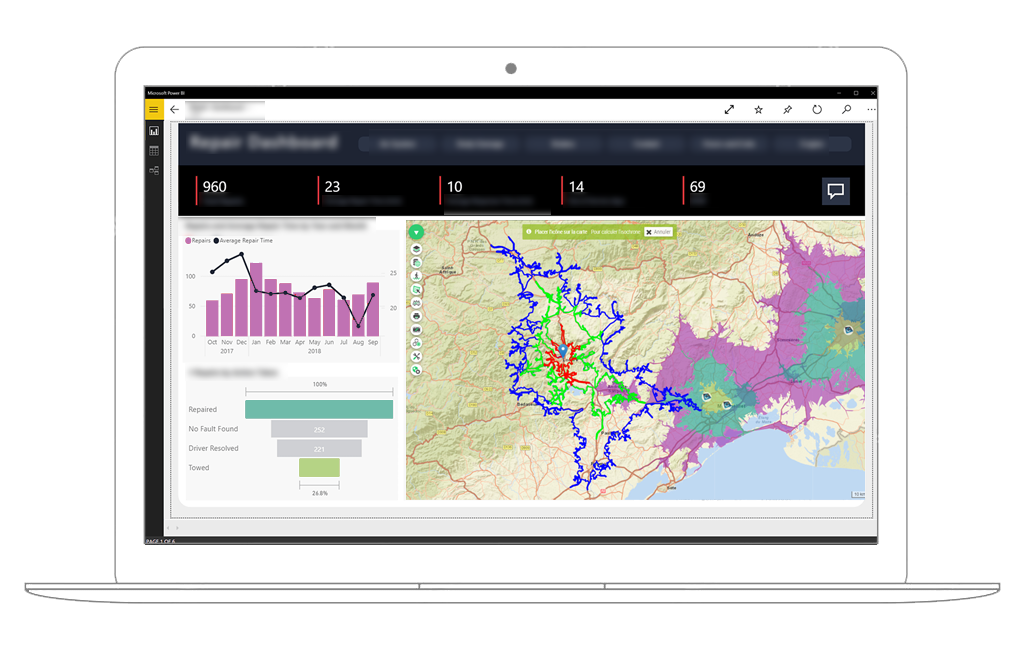
Try our live demo
Discover this interactive Power BI report, leveraging the Galigeo spatial capabilities.
Success stories
Find out how Galigeo solutions integrated into the Microsoft Power BI environment help companies improve their performance.

Heineken
Boosting CRM adoption with location intelligence. With the implementation of Galigeo for its CRM in SaaS mode, Salesforce, Heineken’s sales force is finding client data easier to use and a lot more user-friendly.
General Electric Healthcare
Big data comes to the rescue of sales territory mapping for General Electric Healthcare, a world leader in the manufacture of medical imaging equipment.